
New Delhi, 23 February 2022
- Production of Crude Oil
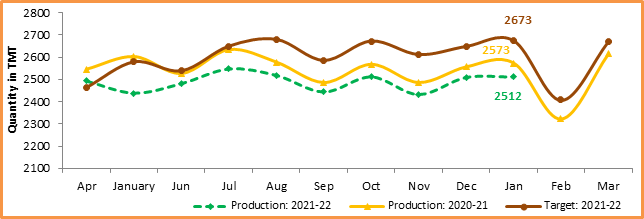
Crude oil production[1] during January 2022 was 2511.66 TMT, which is 6.04% lower than target for the month and 2.40% lower than the production of January 2021. Cumulative crude oil production during April-January, 2021-22 was 24890.07 TMT, which is 4.63% and 2.61% lower than target for the period and production during corresponding period of last year respectively. Unit-wise and State-wise crude oil production is given at Annexure-I. Unit-wise crude oil production for the month of January 2022 and cumulatively for April-January 2021-22 vis-à-vis same period of last year has been shown in Table-1 and month-wise in Figure-1.
Table-1: Crude Oil Production (in TMT)
| Oil Company | Target | January (Month) | April-January (Cumulative) | ||||||
| 2021-22 (Apr-Mar)* | 2021-22 | 2020-21 | % over last year | 2021-22 | 2020-21 | % over last year | |||
| Target* | Prod.* | Prod. | Target* | Prod.* | Prod. | ||||
| ONGC | 20272.88 | 1726.31 | 1662.79 | 1715.74 | 96.91 | 16988.50 | 16259.10 | 16924.83 | 96.07 |
| OIL | 3182.60 | 282.72 | 255.32 | 242.58 | 105.25 | 2635.02 | 2499.16 | 2469.27 | 101.21 |
| PSC Fields | 7718.52 | 664.02 | 593.56 | 615.07 | 96.50 | 6475.29 | 6131.80 | 6162.71 | 99.50 |
| Total | 31173.99 | 2673.04 | 2511.66 | 2573.38 | 97.60 | 26098.81 | 24890.07 | 25556.80 | 97.39 |
Note: Totals may not tally due to rounding off. *: Provisional
Figure-1: Monthly Crude Oil Production
Unit-wise production details with reasons for shortfall are as under:
-
- Crude oil production by ONGC (Oil and Natural Gas Corporation) in nomination block during January 2022 was 1662.79 TMT, which is 3.68% lower than target of the month and 3.09% lower when compared with production of January 2021. Cumulative crude oil production by ONGC during April-January, 2021-22 was 16259.10 TMT, which is 4.29% and 3.93% lower than target for the period and production during corresponding period of last year respectively. Reasons for shortfall in production are as under:
- Less than anticipated production from WO-16 cluster due to delay in mobilization of MOPU Sagar Samrat.
- Less than anticipated production from Cluster-8 fields due to delay in inputs as installation of wellhead platforms got delayed due to Covid impact.
- Loss in oil production in Ratna & R-Series due to scaling in wells and delay in H2S package at R-13A wells.
- Less condensate receipt at Hazira due to less gas production from B&S Asset.
-
- Crude oil production by OIL (Oil India Ltd) in the nomination block during January 2022 was 255.32 TMT, which is 5.25% higher when compared with production of January 2021 but 9.69% lower than target of the month. Cumulative crude oil production by OIL during April-January 2021-22 was 2499.16 TMT, which is 1.21% higher than the production during corresponding period of last year but 5.16% lower than target for the period. Reasons for shortfall in production are as under:
- Less than planned contribution from workover wells and drilling wells.
- Less than planned due to local disturbance & miscreants activities in main producing area (MPA).
-
- Crude oil production by Pvt/JVs companies in the PSC/RSC regime during January 2022 was 593.56 TMT, which is 10.61% lower than the target of the reporting month and 3.50% lower than the month production of January 2021. Cumulative crude oil production by Pvt/JVs companies during April-January 2021-22 was 6131.80 TMT, which is 5.30% and 0.50% lower than target for the period and production during corresponding period of last year respectively. Reasons for shortfall in production are as under:
- MB/OSDSF/B80/2016 (Hindustan Oil Exploration Company Ltd.): Delay in commencement of production. Pre-commissioning in progress.
- RAVVA (Cairn Energy India Ltd): Production shortfall due to lower performance of wells RD-3ST and RD-6ST due to infectivity issues.
- CB-ONN-2004/2 (ONGC): Production shortfall due to less evacuation to IOCL due to leakage and choking in ONGC pipeline.
- CB-OS/2 ((Cairn Energy India Ltd): Production shortfall is due to natural decline and increase in water cut observed in aquifer supported pools and recent sanding/loading issues in the wells.
- Production of Natural Gas
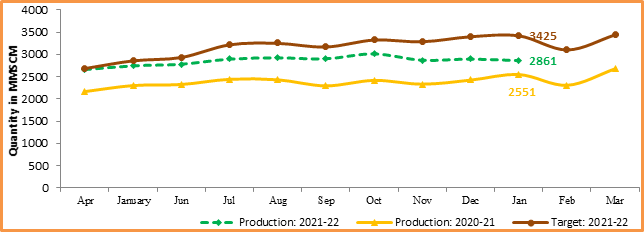
Natural gas production during January 2022 was 2861.09 MMSCM, which is 12.17% higher than the production of January 2021 but 16.47% lower than the monthly target. Cumulative natural gas production during April-January 2021-22 was 28535 MMSCM, which is 20.50% higher than production during corresponding period of last year but 9.59% lower when compared with target for the period. Unit-wise and state-wise natural gas production is given at Annexure-II. Unit-wise natural gas production for the month of January 2022 and cumulatively for April-January 2021-22 vis-à-vis same period of last year has been shown in Table-2 and month-wise in Figure-2.
Table-2: Natural Gas Production (in MMSCM)
| Oil Company | Target | January (Month) | April-January (Cumulative) | ||||||
| 2021-22 (Apr-Mar)* | 2021-22 | 2020-21 | % over last year | 2021-22 | 2020-21 | % over last year | |||
| Target* | Prod.* | Prod. | Target* | Prod.* | Prod. | ||||
| ONGC | 23335.10 | 2000.05 | 1749.35 | 1865.72 | 93.76 | 19488.61 | 17291.18 | 18410.04 | 93.92 |
| OIL | 2949.65 | 250.00 | 232.98 | 211.95 | 109.92 | 2472.91 | 2422.75 | 2081.78 | 116.38 |
| PSC Fields | 11834.60 | 1175.19 | 878.76 | 473.01 | 185.78 | 9600.67 | 8821.07 | 3187.82 | 276.71 |
| Total | 38119.35 | 3425.25 | 2861.09 | 2550.68 | 112.17 | 31562.19 | 28535.00 | 23679.64 | 120.50 |
Note: Totals may not tally due to rounding off. *: Provisional
Figure-2: Monthly Natural Gas Production
-
- Natural gas production by ONGC in the nomination blocks during January 2022 was 1749.35 MMSCM, which is 12.53% lower than target for the month and 6.24% lower than the production of January 2021. Cumulative natural gas production by ONGC during April-January, 2021-22 was 17291.18 MMSCM, which is 11.28% and 6.08% lower than target for the period and production during corresponding period of last year respectively. Reasons for shortfall in production are as under:
- Less than anticipated production from WO-16 cluster due to delay in mobilization of MOPU Sagar Samrat.
- Less than planned production from Vasistha /S1 wells in EOA due to certain reservoir related issues.
- Delay in commencement of gas production from U1 field of KG-98/2 Cluster-II due to covid impact as manufacturing of subsea items and well completion got delayed.
- Less production due to decline in Tapti-Daman block in B&S Asset.
-
- Natural gas production by OIL in the nomination block during January 2022 was 232.98 MMSCM which is 9.92% higher than target for the month and 6.81% lower than the production of January 2021. Cumulative natural gas production by OIL during April-January 2021-22 was 2422.75 MMSCM, which is 16.38% higher than production during corresponding period of last year but 2.03% lower than target for the period. Shortfall in production is due to less than planned contribution from workover wells and drilling wells.
-
- Natural gas production by Pvt/JVs companies in the PSC/RSC/CBM regime during January 2022 was 878.76 MMSCM, which is 85.78% higher than the production of January 2021 but 25.22% lower than the target for the month. Cumulative natural gas production by Pvt/JVs during April-January, 2021-22 was 8821.07 MMSCM, which is 176.71% higher than production during corresponding period of last year but 8.12% lower than target for the period. Reasons for shortfall in production are as under:
- KG-DWN-98/2 (ONGC): Delay in commencement of production. Pre-commissioning in progress.
- KG-DWN-98/3 (RIL): Production shortfall due to well intervention jobs in some wells.
- RJ-ON-90/1 (Cairn Energy India Ltd): Few Gas wells of RDG field are not producing as per expectations.
- RANIGANJ EAST (Essar Oil and Gas Exploration and Production Ltd.): Shortfall because delay in scheduled operations.
- RJ-ON//6 (FEL): Production shortfall due to less offtake by customer.
- Crude Oil Processed (Crude Throughput)
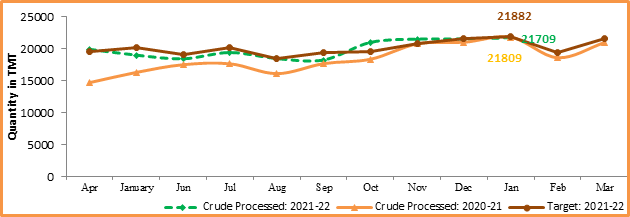
Crude Oil Processed during January 2022 was 21708.56 TMT, which is 3.03% lower than target for the month and 0.46% lower than the January 2021. Cumulative crude processed during April-January 2021-22 was 198923.79 TMT, which is 1.24 and 9.20% higher than target for the period and production during corresponding period of last year respectively. Refinery-wise details of the crude throughput and capacity utilization during the month of January 2022 vis-à-vis January 2021 are given at Annexure-III and Annexure-IV. Company-wise crude throughput for the month of January 2021 and cumulatively for the period April-January 2021-22 vis-à-vis same period of last year has been shown in Table-3 and month-wise in Figure-3.
Table 3: Crude Oil Processed (Crude Throughput) (in TMT)
| Oil Company | Target | January (Month) | April-January (Cumulative) | |||||||
| 2021-22 (Apr-Mar)* | 2021-22 | 2020-21 | % over last year | 2021-22 | 2020-21 | % over last year | ||||
| Target* | Prod.* | Prod. | Target* | Prod.* | Prod. | |||||
| CPSE | 143300.54 | 13762.56 | 12876.14 | 13204.06 | 97.52 | 116065.59 | 111874.24 | 102932.72 | 108.69 | |
| IOCL | 69120.46 | 6791.00 | 5843.72 | 6278.12 | 93.08 | 56191.56 | 55243.43 | 51036.68 | 108.24 | |
| BPCL | 29801.53 | 2715.00 | 2752.96 | 2893.30 | 95.15 | 24380.53 | 24418.03 | 20788.41 | 117.46 | |
| HPCL | 17751.16 | 1579.64 | 1644.80 | 1438.94 | 114.31 | 14070.69 | 10923.44 | 13464.67 | 81.13 | |
| CPCL | 9130.00 | 998.39 | 915.07 | 917.46 | 99.74 | 7133.21 | 7049.89 | 6521.75 | 108.10 | |
| NRL | 2840.00 | 248.00 | 271.97 | 248.84 | 109.29 | 2368.00 | 2202.18 | 2239.35 | 98.34 | |
| MRPL | 14594.35 | 1425.00 | 1440.33 | 1419.84 | 101.44 | 11869.35 | 11974.68 | 8815.80 | 135.83 | |
| ONGC | 63.04 | 5.53 | 7.30 | 7.56 | 96.52 | 52.25 | 62.59 | 66.06 | 94.74 | |
| JVs | 18079.47 | 1514.50 | 1821.92 | 1495.73 | 121.81 | 15208.47 | 17036.26 | 14019.61 | 121.52 | |
| BORL | 7058.47 | 578.50 | 721.98 | 694.44 | 103.97 | 5968.47 | 6111.79 | 4986.03 | 122.58 | |
| HMEL | 11021.00 | 936.00 | 1099.94 | 801.29 | 137.27 | 9240.00 | 10924.47 | 9033.58 | 120.93 | |
| Private | 78008.07 | 7109.20 | 7010.49 | 7109.19 | 98.61 | 65218.19 | 70013.29 | 65218.19 | 107.35 | |
| RIL | 60940.96 | 5564.40 | 5277.05 | 5564.40 | 94.84 | 51174.65 | 53102.23 | 51174.65 | 103.77 | |
| NEL | 17067.11 | 1544.80 | 1733.44 | 1544.80 | 112.21 | 14043.54 | 16911.06 | 14043.54 | 120.42 | |
| TOTAL | 239388.08 | 22386.26 | 21708.56 | 21808.99 | 99.54 | 196492.25 | 198923.79 | 182170.52 | 109.20 | |
Note: Totals may not tally due to rounding off. *: Provisional
Figure 3: Crude Oil Processed (Crude Throughput)
3.1 CPSE Refineries’ crude oil processed during January 2022 was 12876.14 TMT, which is 6.44% lower than target for the month and 2.48% lower than the production of January 2021. Cumulative crude throughput during April-January 2021-22 was 111874.24 TMT which is 8.69% lower than corresponding period of last year but 3.61% lower than target for the period. Reasons for shortfall in production are as under:
- IOCL-Haldia Refinery: Monthly Crude processed lower due to deferment of Crude Distillation Unit-2 (CDU) shutdown and Extension of CDU-2 shutdown.
- IOCL-Mathura & Panipat Refinery: Monthly Crude processed in line of products demand.
- IOCL-Bongaigaon Refinery: Monthly Crude processed in line of crude availability.
- IOCL-Paradip Refinery: Monthly crude processed marginally low due to leak in reaction furnace of Sulphur recovery unit.
- HPCL, Visakh Refinery: Monthly Crude processed lower due to shutdown of Primary Crude Processing Units.
- CPCL-Manali Refinery: Monthly Crude processed lower due to lower Bitumen/Petcoke upliftment.
3.2 JV refineries’ crude oil processed during January 2022 was 1821.92 TMT, which is 20.30% higher than the target for the month and 21.81% higher than January 2021. Cumulative crude throughput during April-January 2021-22 was 17036.26 TMT, which is 12.02% and 21.52% higher than target for the period and production during corresponding period of last year respectively.
3.3 Private refineries’ crude oil processed during January 2022 was 7010.49 TMT, which is 1.39% lower than the corresponding month of last year. Cumulative crude throughput during April-January 2021-22 was 70013.29 TMT, which is 7.35% higher than the corresponding period of last year.
- Production of Petroleum Products
-
- Production of Petroleum Products during January 2021 was 22997.96 TMT, which is 3.55% higher than production of January 2021 and 3.72% higher than target for the month. Cumulative production during April-January, 2021-22 was 209006.59 TMT, which is 1.71% and 9.29% higher than target for the period and production during corresponding period of last year respectively. Unit-wise production of petroleum products is given at Annexure-V. Company-wise production for the month of January 2021-22 and cumulatively for April-January, 2021 vis-à-vis same period of last year has been shown in Table-4 and month-wise in Figure-4.
Figure 4: Monthly Refinery Production of Petroleum Products
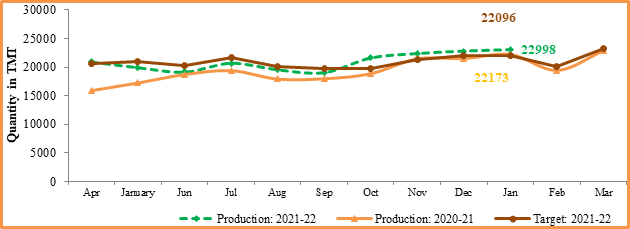
Table 4: Production of Petroleum Products (TMT)
| Oil Company | Target | January (Month) | April-January (Cumulative) | ||||||
| 2021-22 (Apr-Mar)* | 2021-22 | 2020-21 | % over last year | 2021-22 | 2020-21 | % over last year | |||
| Target* | Prod.* | Prod. | Target* | Prod.* | Prod. | ||||
| CPSE | 135423.57 | 12617.32 | 12161.89 | 12536.36 | 97.01 | 110518.32 | 105927.22 | 97481.15 | 108.66 |
| IOCL | 65757.60 | 6161.75 | 5602.18 | 6126.82 | 91.44 | 54011.23 | 53005.56 | 49048.58 | 108.07 |
| BPCL | 27811.21 | 2558.84 | 2578.29 | 2684.05 | 96.06 | 22696.04 | 23293.33 | 19835.97 | 117.43 |
| HPCL | 16583.96 | 1478.45 | 1522.96 | 1420.09 | 107.24 | 13142.69 | 10173.94 | 12580.36 | 80.87 |
| CPCL | 9279.11 | 864.85 | 860.95 | 825.11 | 104.34 | 7633.11 | 6455.10 | 5955.69 | 108.39 |
| NRL | 2839.03 | 247.92 | 272.87 | 252.95 | 107.88 | 2367.19 | 2165.08 | 2267.67 | 95.48 |
| MRPL | 13092.62 | 1300.24 | 1317.71 | 1220.14 | 108.00 | 10618.31 | 10774.50 | 7729.59 | 139.39 |
| ONGC | 60.02 | 5.27 | 6.92 | 7.21 | 96.01 | 49.75 | 59.71 | 63.29 | 94.34 |
| JVs | 16813.56 | 1322.16 | 1651.08 | 1378.92 | 119.74 | 14161.02 | 15754.65 | 13002.12 | 121.17 |
| BORL | 6547.56 | 539.16 | 647.61 | 598.49 | 108.21 | 5530.02 | 5441.70 | 4368.42 | 124.57 |
| HMEL | 10266.00 | 783.00 | 1003.47 | 780.43 | 128.58 | 8631.00 | 10312.96 | 8633.70 | 119.45 |
| Private | 93222.97 | 7907.34 | 8850.89 | 7907.34 | 111.93 | 77209.90 | 83893.87 | 77209.90 | 108.66 |
| RIL | 76683.16 | 6429.86 | 7227.56 | 6429.86 | 112.41 | 63602.59 | 67649.24 | 63602.59 | 106.36 |
| NEL | 16539.81 | 1477.48 | 1623.33 | 1477.48 | 109.87 | 13607.31 | 16244.63 | 13607.31 | 119.38 |
| Total Refinery | 245460.10 | 21846.83 | 22663.86 | 21822.62 | 103.85 | 201889.24 | 205575.75 | 187693.17 | 109.53 |
| Fractionators | 4331.28 | 363.33 | 334.10 | 350.53 | 95.31 | 3609.63 | 3430.84 | 3550.95 | 96.62 |
| TOTAL | 249791.38 | 22210.16 | 22997.96 | 22173.16 | 103.72 | 205498.88 | 209006.59 | 191244.12 | 109.29 |
Note: Totals may not tally due to rounding off. *: Provisional
-
- Production of petroleum Products by Oil’s Refineries during January 2022 was 22663.86 TMT, which is 3.74% higher than production of January 2021 and 3.85% higher when compared with target for the month. Cumulative production during April-January, 2021-22 was 205575.75 TMT, which is 1.83% and 9.53% higher than target for the period and production during corresponding period of last year respectively.
-
- Production of petroleum Products by Fractionators during January 2022 was 334.10 TMT, which is 8.05% lower than the target for the month and 4.69% lower than production of January 2021. Cumulative production during April-January, 2021-22 was 3430.84 TMT, which is 4.95% and 3.38% lower than target for the period and production during corresponding period of last year respectively.
Click here to see Annexure III