
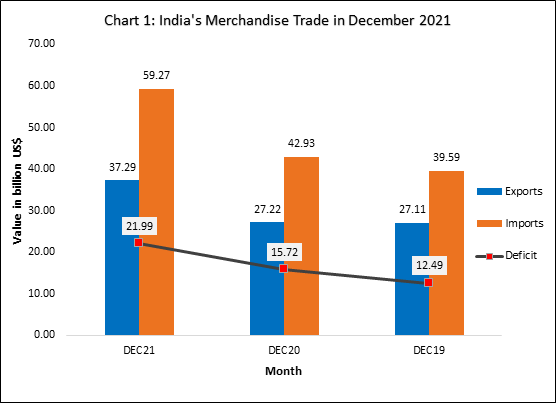
New Delhi, 03 January 2022: India’s merchandise import in December 2021 was USD 59.27 billion, an increase of 38.06% over USD 42.93 billion in December 2020 and an increase of 49.7% over USD 39.59 billion in December 2019.
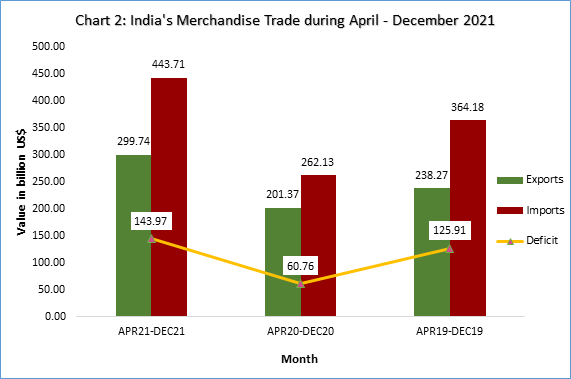
India’s merchandise import in April-December 2021 was USD 443.71 billion, an increase of 69.27% over USD 262.13 billion in April-December 2020 and an increase of 21.84% over USD 364.18 billion in April-December 2019.
The trade deficit in December 2021 was USD 21.99 billion, while it was 143.97 billion USD during April-December 2021.
| Statement 1: India’s Merchandise Trade in December 2021 | |||||
| Value in Billion USD | % Growth | ||||
| Dec-21 | Dec-20 | Dec-19 | Dec-21 over Dec-20 | Dec-21 over Dec-19 | |
| Exports | 37.29 | 27.22 | 27.11 | 37.00 | 37.55 |
| Imports | 59.27 | 42.93 | 39.59 | 38.06 | 49.70 |
| Deficit | 21.99 | 15.72 | 12.49 | 39.90 | 76.10 |
| Statement 2: India’s Merchandise Trade in Apr-Dec 2021 | |||||
| Value in Billion USD | % Growth | ||||
| Apr-Dec21 | Apr-Dec20 | Apr-Dec19 | Apr-Dec 21 over Apr-Dec 20 | Apr-Dec 21 over Apr-Dec 19 | |
| Exports | 299.74 | 201.37 | 238.27 | 48.85 | 25.80 |
| Imports | 443.71 | 262.13 | 364.18 | 69.27 | 21.84 |
| Deficit | 143.97 | 60.76 | 125.91 | 136.94 | 14.34 |
Value of non-petroleum exports in December 2021 was 31.67 USD billion, registering a positive growth of 27.31% over non-petroleum exports of USD 24.88 billion in December 2020 and a positive growth of 34.92% over non-petroleum exports of USD 23.48 billion in December 2019.
Value of non-petroleum imports was USD 43.37 billion in December 2021 with a positive growth of 30.22% over non-petroleum imports of USD 33.31 billion in December 2020 and a positive growth of 50.20% over non-petroleum imports of USD 28.88 billion in December 2019.
| Statement 3: Merchandise Non-POL Trade in December 2021 | |||||
| Value in Billion USD | % Growth | ||||
| Dec-21 | Dec-20 | Dec-19 | Dec-21 over Dec-20 | Dec-21 over Dec-19 | |
| Exports | 31.67 | 24.88 | 23.48 | 27.31 | 34.92 |
| Imports | 43.37 | 33.31 | 28.88 | 30.22 | 50.20 |
The cumulative value of non-petroleum exports in April-December 2021 was USD 257.14 billion, an increase of 39.82% over USD 183.91 billion in April-December 2020 and an increase of 24.74% over USD 206.13 billion in April-December 2019.
The cumulative value of non-petroleum imports in April-December 2021 was USD 325.73 billion, showing an increase of 56.41% compared to non-oil imports of USD 208.25 billion in April-December 2020 and an increase of 21.78% compared to non-oil imports of USD 267.47 billion in April-December 2019.
| Statement 4: Merchandise Non-POL Trade Apr-Dec 2021 | |||||
| Value in Billion USD | % Growth | ||||
| Apr-Dec21 | Apr-Dec20 | Apr-Dec19 | Apr-Dec21 over Apr-Dec20 | Apr-Dec21 over Apr-Dec19 | |
| Exports | 257.14 | 183.91 | 206.13 | 39.82 | 24.74 |
| Imports | 325.73 | 208.25 | 267.47 | 56.41 | 21.78 |
Value of non-petroleum and non-gems and jewellery exports in December 2021 was USD 28.69 billion, registering a positive growth of 28.64% over non-petroleum and non-gems and jewellery exports of USD 22.30 billion in December 2020 and a positive growth of 36.21% over non-petroleum and non-gems and jewellery exports of USD 21.06 billion in December 2019.
Value of non-oil, non-GJ (gold, silver & Precious metals) imports was USD 35.57 billion in December 2021 with a positive growth of 34.68% over non-oil and non-GJ imports of USD 26.41 billion in December 2020 and a positive growth of 47.75% over non-oil and non-GJ imports of USD 24.07 billion in December 2019.
| Statement 5: Merchandise Non-POL Non-GJ Trade in December 2021 | |||||
| Value in Billion USD | % Growth | ||||
| Dec-21 | Dec-20 | Dec-19 | Dec-21 over Dec-20 | Dec-21 over Dec-19 | |
| Exports | 28.69 | 22.30 | 21.06 | 28.64 | 36.21 |
| Imports | 35.57 | 26.41 | 24.07 | 34.68 | 47.75 |
The cumulative value of non-petroleum and non-gems and jewellery exports in April-December 2021 was USD 228.25 billion, an increase of 36.66% over cumulative value of non-petroleum and non-gems and jewellery exports of USD 167.02 billion in April-December 2020 and an increase of 28.12% over cumulative value of non-petroleum and non-gems and jewellery exports of USD 178.15 billion in April-December 2019.
Non-oil, non-GJ (Gold, Silver & Precious Metals) imports was USD 263.66 billion in April-December 2021, recording a positive growth of 47.33%, as compared to non-oil and non-GJ imports of USD 178.96 billion in April-December 2020 and a positive growth of 17.20% over USD 224.96 billion in April-December 2019.
| Statement 6: Merchandise Non-POL Non-GJ Trade Apr-Dec 2021 | |||||
| Value in Billion USD | % Growth | ||||
| Apr-Dec 21 | Apr-Dec 20 | Apr-Dec 19 | Apr-Dec 21 over Apr-Dec 20 | Apr-Dec 21 over Apr-Dec 19 | |
| Exports | 228.25 | 167.02 | 178.15 | 36.66 | 28.12 |
| Imports | 263.66 | 178.96 | 224.96 | 47.33 | 17.20 |
Top 10 major commodity groups covering 79% of total exports and showing positive growths in December 2021 over corresponding month of previous year, are –
| Statement 7: Exports of Top 10 Major Commodity Groups | ||||
| Value of Export (Million US$) | Share (%) | Growth (%) | ||
| Major Commodity Group | Dec-21 | Dec-20 | Dec-21 | Dec-21 over Dec-20 |
| Engineering goods | 9708.94 | 7072.63 | 26.04 | 37.27 |
| Petroleum products | 5611.70 | 2336.63 | 15.05 | 140.16 |
| Gems and Jewellery | 2982.55 | 2575.67 | 8.00 | 15.80 |
| Organic and Inorganic chemicals | 2646.32 | 2100.00 | 7.10 | 26.01 |
| Drugs and Pharmaceuticals | 2288.20 | 2203.53 | 6.14 | 3.84 |
| Electronic goods | 1663.70 | 1248.33 | 4.46 | 33.27 |
| RMG of all Textiles | 1460.36 | 1195.78 | 3.92 | 22.13 |
| Cotton Yarn/Fabs./Madeups, Handloom products etc. | 1439.44 | 987.76 | 3.86 | 45.73 |
| Plastic and Linoleum | 893.02 | 570.49 | 2.40 | 56.54 |
| Rice | 882.62 | 682.77 | 2.37 | 29.27 |
| Total of 10 Major Commodity Groups | 29576.85 | 20973.58 | 79.33 | 41.02 |
| Rest | 7708.21 | 6242.71 | 20.67 | 23.48 |
| Total Exports | 37285.07 | 27216.29 | 100.00 | 37.00 |
Top 10 major commodity groups covering 78% of total imports, are –
| Statement 8: Imports of Top 10 Major Commodity Groups | ||||
| Import (Million US$) | Share (%) | Growth (%) | ||
| Major Commodity Group | Dec-21 | Dec-20 | Dec-21 | Dec-21 over Dec-20 |
| Petroleum, Crude & products | 15904.53 | 9629.01 | 26.83 | 65.17 |
| Electronic goods | 6532.02 | 5037.69 | 11.02 | 29.66 |
| Gold | 4690.68 | 4485.76 | 7.91 | 4.57 |
| Machinery, electrical & non-electrical | 3878.29 | 3149.33 | 6.54 | 23.15 |
| Organic & Inorganic Chemicals | 3224.79 | 1879.88 | 5.44 | 71.54 |
| Pearls, precious & Semi-precious stones | 2882.49 | 2397.17 | 4.86 | 20.25 |
| Coal, Coke & Briquettes, etc. | 2796.08 | 1624.32 | 4.72 | 72.14 |
| Transport equipment | 2265.75 | 2476.59 | 3.82 | -8.51 |
| Artificial resins, plastic materials, etc. | 1961.81 | 1434.57 | 3.31 | 36.75 |
| Vegetable Oil | 1822.63 | 1210.88 | 3.07 | 50.52 |
| Total of 10 Major Commodity Groups | 45959.08 | 33325.21 | 77.54 | 37.91 |
| Rest | 13315.21 | 9609.34 | 22.46 | 38.57 |
| Total Imports | 59274.29 | 42934.54 | 100.00 | 38.06 |